Demand Volatility & Production Alignment
Model regional demand shifts against plant capacity, supplier constraints, and dealer inventory to prevent overproduction or allocation errors.


Automotive
Simulate demand shifts, supplier exposure, and electrification scenarios against working capital and margin impact.
Workflow 1 — Throughput Stress Envelope
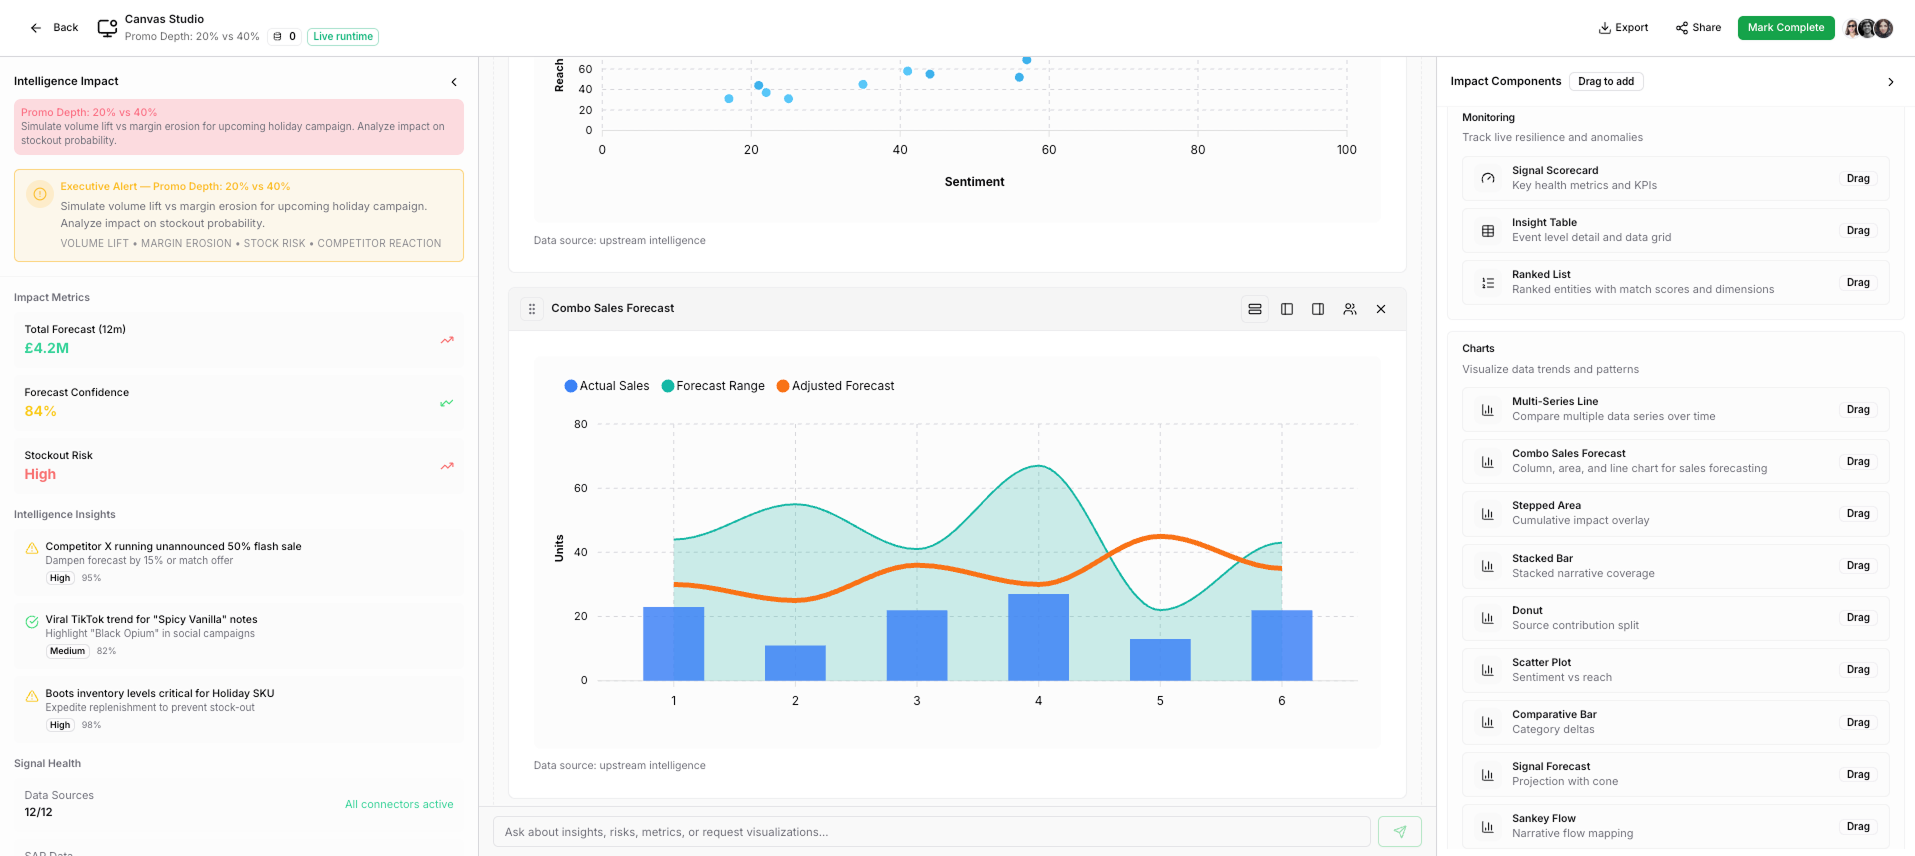
Blue: Demand forecast · Grey: Max capacity · Red: Constrained capacity · Shaded: Volatility band
82%
3 critical nodes
18%
+11%
Recommended actions
Causal timeline
Throughput Stress Envelope
Bottleneck signal feeds constraint impact allocation.
Impact → Rebalance
Impact scores feed node-level optimisation and cost-to-serve.
Constraint Impact Allocation
Allocation feeds operating model rebalance.
Model → Systems
Model changes feed MES / WMS scheduling and capacity plans.
Operating Model Rebalance Map
Model changes committed to ERP / MES / WMS.
Where demand crosses constrained capacity → amber/red
Establishes operational constraint envelope.


Model regional demand shifts against plant capacity, supplier constraints, and dealer inventory to prevent overproduction or allocation errors.
Map Tier 1 and Tier 2 supplier exposure to geopolitical risk, commodity shocks, and regulatory shifts. Simulate cascading production impact.
Stress-test electrification investments against battery costs, policy incentives, consumer uptake curves, and margin pressure.
Consolidate unstructured customer feedback, dealer data, and defect signals into early risk detection models tied to financial impact.
Optimise vehicle allocation, reduce floorplan financing strain, and balance supply across regions based on real demand physics.
Model steel, lithium, semiconductor, and logistics cost fluctuations and see downstream impact on margin and pricing strategy.
Adopted by forward-thinking executive teams, Nimbus connects finance, operations and commercial data into a unified causal model — empowering leaders to simulate strategy, quantify ROI, and act with zero decision latency.

Simulation

A New Paradigm for CFOs & COOs
Intelligence Infrastructure
Every operation shares organizational context. Every decision is traceable. Every outcome propagates. Nimbus connects your business processes through a shared model of cause and effect.
Learn moreNimbus turns the complexity of modern organisations into a living system where agents, workflows and data continuously adapt to guide better decisions.
How simulation-driven decision-making and digital twins can help rebuild trust and resilience in global agri-food supply chains.
Senior executives at leading OEMs recognize that today's market pressures – surging EV competition, software-defined vehicles, volatile supply chains, and AI-driven planning – demand unprecedented cross-functional collaboration. Yet most product, engineering, supply-chain, sales and marketing teams remain trapped in silos, each with its own data, assumptions and priorities.
Traditional FMCG product research methods increasingly fall short in today's fast-moving markets. Companies often rely on static dashboards, quarterly reports and one-off surveys that only capture lagging indicators of consumer behavior and market conditions.